Model Performance Evaluation
About model performance evaluation
Definition
- What it does: Model performance evaluation measures inference service efficiency (throughput and latency) in a realistic deployment setting.
- Requirement: The model inference service must be reachable via the streaming API at
/v1/chat/completions.
How to run a performance evaluation
- Write your script following the “Model performance evaluation run script” section below. Note: Only the model adapter repository admin can start a performance evaluation, and the repository hardware type must be NPU.
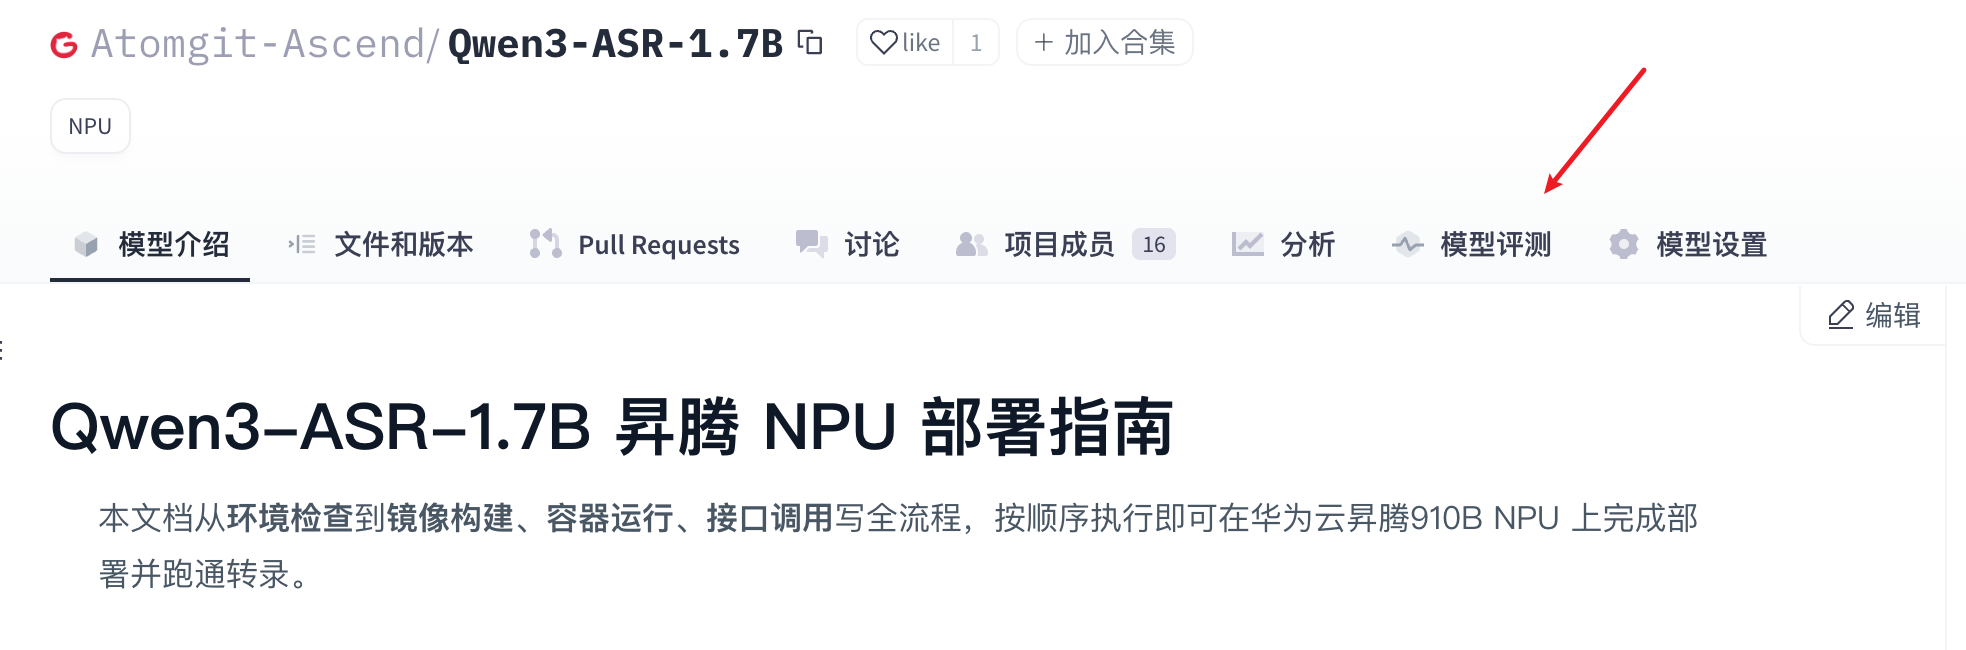
- Open the Model evaluation tab and go to the model evaluation page.
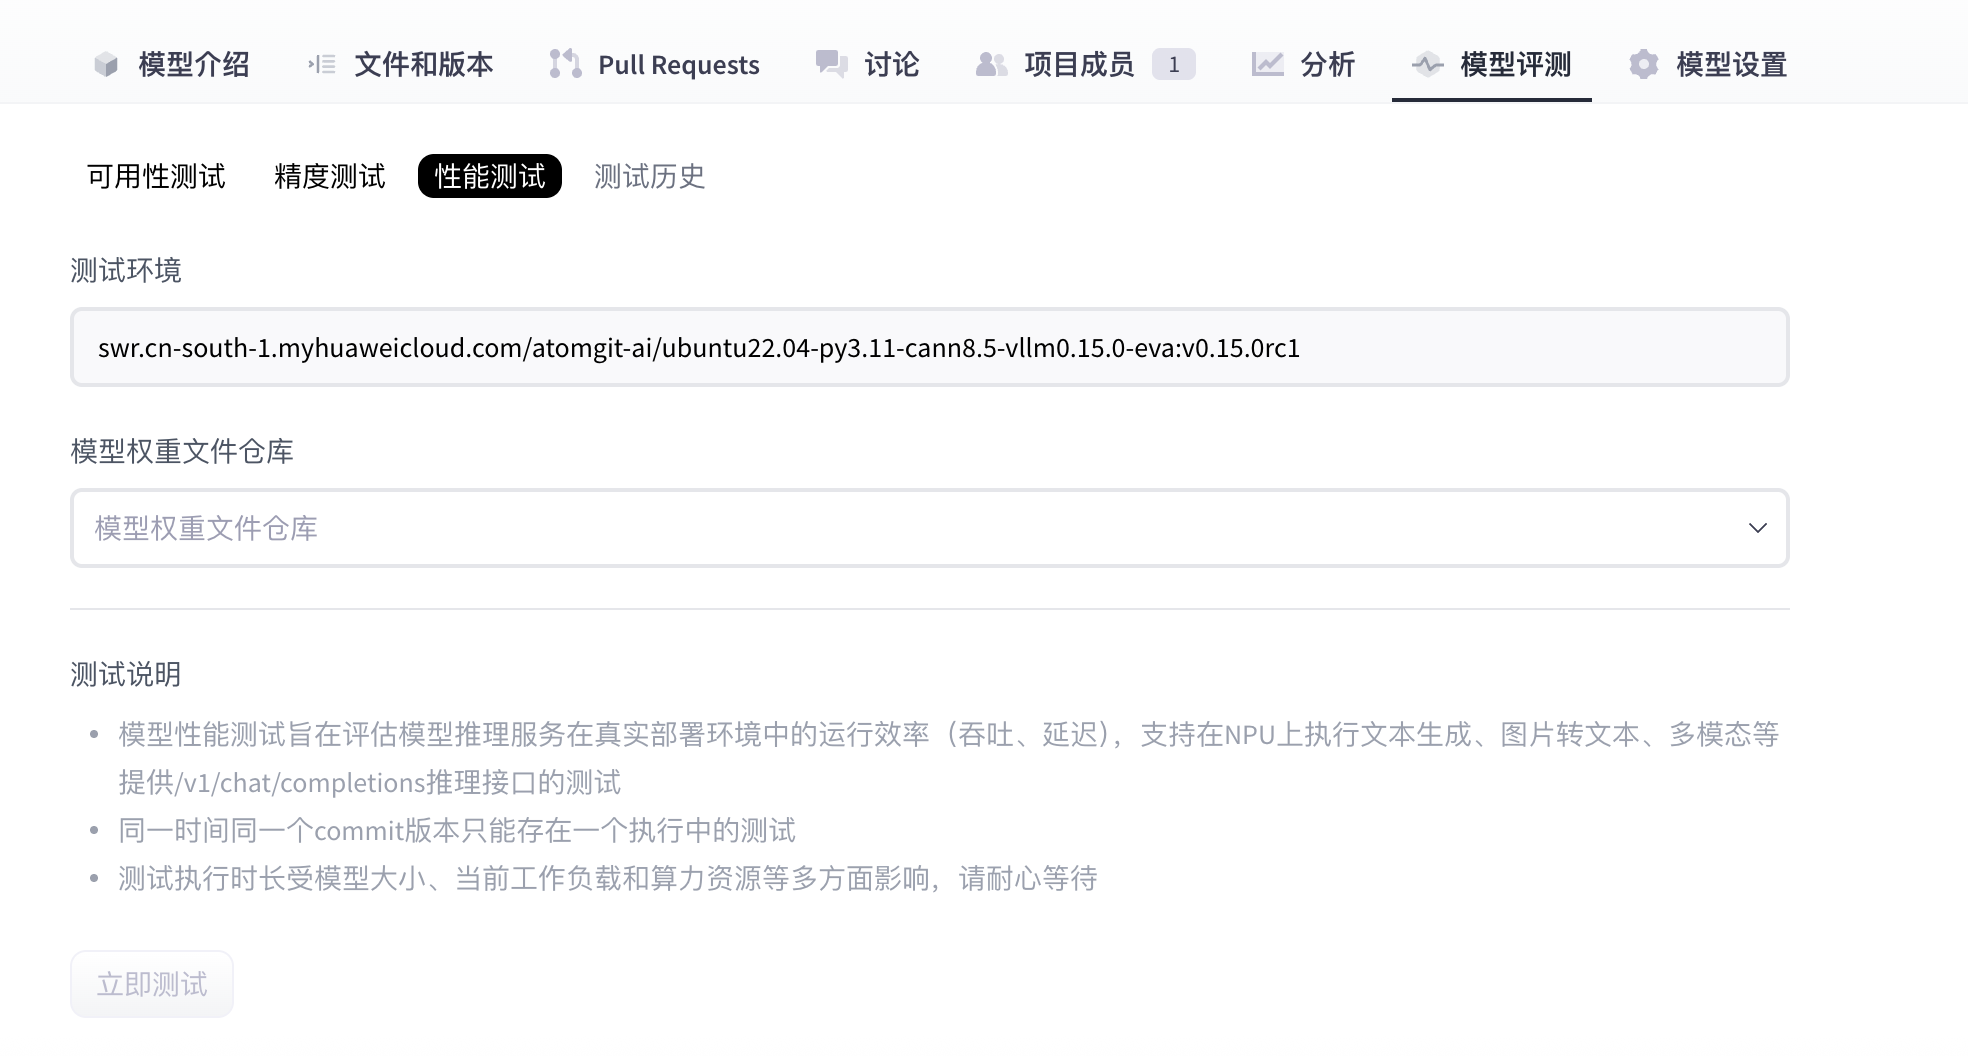
- On the model evaluation page, open the Performance tab, select the model weights, then click Run test to start.
- Wait until the performance test cases finish.
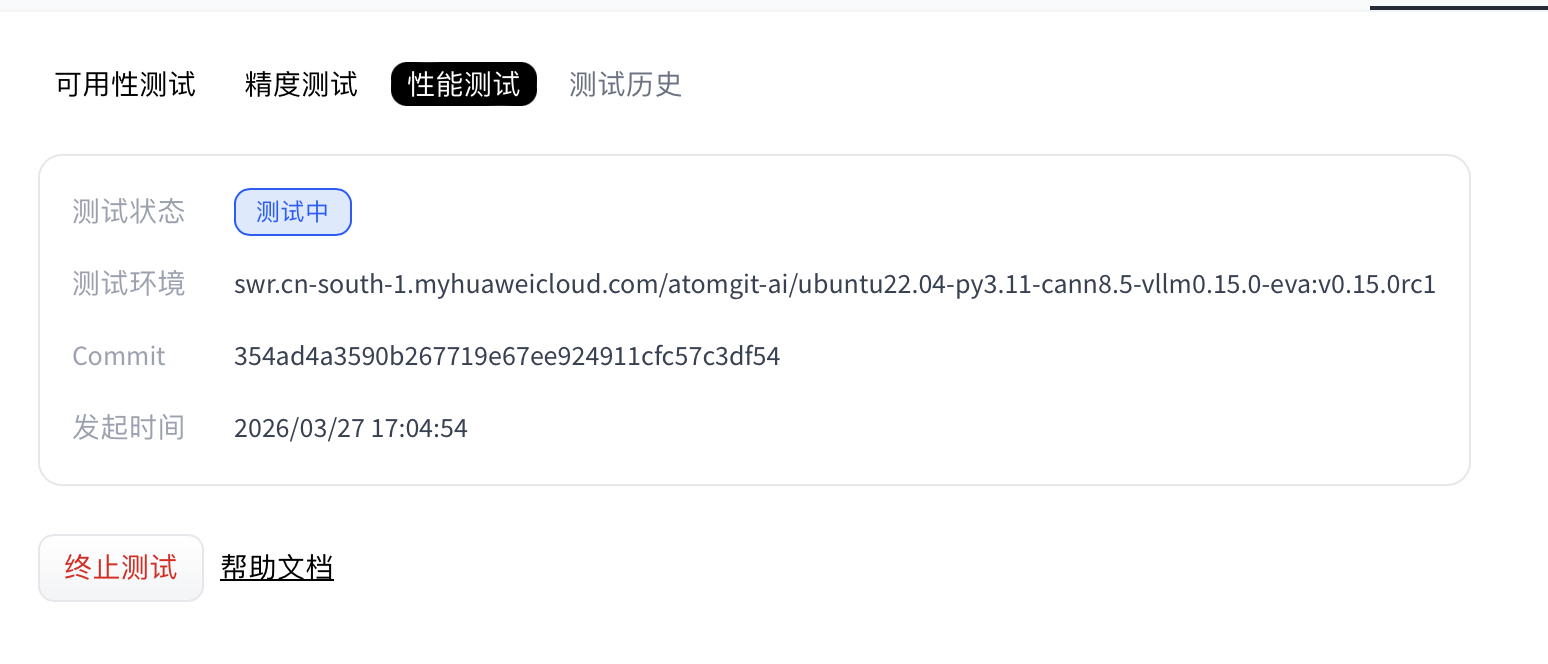
- (Optional) While status is Running, you can click Stop test to cancel the performance run.
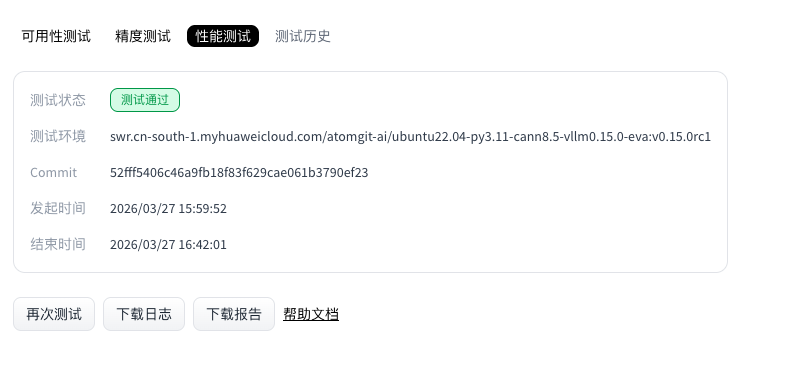
- When the run completes, the Performance section shows status and provides logs and report downloads.
Model performance evaluation run script
Performance evaluation uses deploy.sh as the entry point. Follow this document strictly when writing scripts.
The adapter repository must include these two files:
requirements.txt: Python packages needed to run the script. Omit if there are no extra dependencies (optional).deploy.sh: The evaluation service uses this script to install dependencies and start the adapter project (required).
File locations
requirements.txt and deploy.sh must be at the repository root.
requirements.txt (optional)
List NPU-side dependencies. Torch NPU, CANN, and Python are provided by the environment—do not duplicate them in requirements.txt. Example:
transformers==4.37.0
accelerate==0.27.2
If you need no extra packages, you may omit the .txt file; the job skips dependency installation.
deploy.sh
This shell script starts model adapter inference; how you run inference inside is flexible. Conventions below apply.
Example: install dependencies (optional)
python3 -m pip install --upgrade pip setuptools wheel
Passing parameters into the script
Weights are downloaded at test time from the repository selected when you started evaluation. Use $MODEL_PATH for the weight path. vLLM example:
vllm serve "$MODEL_PATH" --trust-remote-code --tensor-parallel-size 1 --dtype float16 --max-num-seqs 4 --gpu-memory-utilization 0.95
Adapter code requirements
Inference must expose a standard OpenAPI-compatible inference API, and the HTTP server must listen on port 8000. The evaluation service calls the matching inference API for the selected weights’ task type. Supported task types:
| Task type | Task code | Inference API path |
|---|---|---|
| Text generation | text-generation | /v1/chat/completions |
| Image to text | image-text-to-text | /v1/chat/completions |
| Multimodal | any-to-any | /v1/chat/completions |
Note: Performance evaluation relies on
/v1/chat/completions. If that endpoint is missing, the performance job fails.
Model weight size limit
- Maximum size: 100 GB
- Rule: Adapter weight storage must not exceed this limit.
- If exceeded: Weight download fails and the evaluation job fails.
End-to-end example
deploy.sh
- vLLM adapter example:
#!/bin/sh
set -e
echo "=== MODEL_PATH set to: $MODEL_PATH ==="
vllm serve "$MODEL_PATH"  --trust-remote-code --tensor-parallel-size 1 --dtype float16   --max-num-seqs 4  --gpu-memory-utilization 0.95
Note: In this vLLM example you do not need
--served-model-name; the evaluation service uses the weight path as the served model name automatically.
Performance report
After a successful run, download and unzip the performance report. It contains configs, logs, and performance.
Directory layout:
ee9480acbbac4d4aa190a124d5ddf39c/
├── configs               # All dumped configuration files
├── logs                  # Runtime logs; with --debug, step logs go to stdout only
│   └── performance/      # Inference-phase logs
└── performance           # Performance results
│    └── vllm-api-stream-chat/          # “Served model” name; matches `abbr` under `models` in the task config
│         ├── gsm8kdataset.csv          # Per-request metrics (CSV); matches the Performance Parameters table in logs
│         ├── gsm8kdataset.json         # End-to-end metrics (JSON); matches the Common Metric table in logs
│         ├── gsm8kdataset_details.json # Full trace log (JSON)
│         └── gsm8kdataset_plot.html    # Interactive concurrency visualization (HTML)
Viewing performance output
Example log excerpt:
03/26 20:22:24 - AISBench - INFO - Performance Results of task: vllm-api-stream-chat/gsm8kdataset:

╒══════════════════════════╤═════════╤══════════════════╤══════════════════╤══════════════════╤══════════════════╤══════════════════╤══════════════════╤══════════════════╤══════╕
│ Performance Parameters   │ Stage   │ Average          │ Min              │ Max              │ Median           │ P75              │ P90              │ P99              │  N   │
╞══════════════════════════╪═════════╪══════════════════╪══════════════════╪══════════════════╪══════════════════╪══════════════════╪══════════════════╪══════════════════╪══════╡
│ E2EL                     │ total   │ 2048.2945  ms    │ 1729.7498 ms     │ 3450.96 ms       │ 2491.8789 ms     │ 2750.85 ms       │ 3184.9186 ms     │ 3424.4354 ms     │ 8    │
├──────────────────────────┼─────────┼──────────────────┼──────────────────┼──────────────────┼──────────────────┼──────────────────┼──────────────────┼──────────────────┼──────┤
│ TTFT                     │ total   │ 50.332 ms        │ 50.6244 ms       │ 52.0585 ms       │ 50.3237 ms       │ 50.5872 ms       │ 50.7566 ms       │ 50 .0551 ms      │ 8    │
├──────────────────────────┼─────────┼──────────────────┼──────────────────┼──────────────────┼──────────────────┼──────────────────┼──────────────────┼──────────────────┼──────┤
│ TPOT                     │ total   │ 10.6965 ms       │ 10.061 ms        │ 10.8805 ms       │ 10.7495 ms       │ 10.7818 ms       │ 10.808 ms        │ 10.8582 ms       │ 8    │
├──────────────────────────┼─────────┼──────────────────┼──────────────────┼──────────────────┼──────────────────┼──────────────────┼──────────────────┼──────────────────┼──────┤
│ ITL                      │ total   │ 10.6965 ms       │ 7.3583 ms        │ 13.7707 ms       │ 10.7513 ms       │ 10.8009 ms       │ 10.8358 ms       │ 10.9322 ms       │ 8    │
├──────────────────────────┼─────────┼──────────────────┼──────────────────┼──────────────────┼──────────────────┼──────────────────┼──────────────────┼──────────────────┼──────┤
│ InputTokens              │ total   │ 1512.5           │ 1481.0           │ 1566.0           │ 1511.5           │ 1520.25          │ 1536.6           │ 1563.06          │ 8    │
├──────────────────────────┼─────────┼──────────────────┼──────────────────┼──────────────────┼──────────────────┼──────────────────┼──────────────────┼──────────────────┼──────┤
│ OutputTokens             │ total   │ 287.375          │ 200.0            │ 407.0            │ 280.0            │ 322.75           │ 374.8            │ 403.78           │ 8    │
├──────────────────────────┼─────────┼──────────────────┼──────────────────┼──────────────────┼──────────────────┼──────────────────┼──────────────────┼──────────────────┼──────┤
│ OutputTokenThroughput    │ total   │ 115.9216 token/s │ 107.6555 token/s │ 116.5352 token/s │ 117.6448 token/s │ 118.2426 token/s │ 118.3765 token/s │ 118.6388 token/s │ 8    │
╘══════════════════════════╧═════════╧══════════════════╧══════════════════╧══════════════════╧══════════════════╧══════════════════╧══════════════════╧══════════════════╧══════╛
╒══════════════════════════╤═════════╤════════════════════╕
│ Common Metric            │ Stage   │ Value              │
╞══════════════════════════╪═════════╪════════════════════╡
│ Benchmark Duration       │ total   │ 19897.8505 ms      │
├──────────────────────────┼─────────┼────────────────────┤
│ Total Requests           │ total   │ 8                  │
├──────────────────────────┼─────────┼────────────────────┤
│ Failed Requests          │ total   │ 0                  │
├──────────────────────────┼─────────┼────────────────────┤
│ Success Requests         │ total   │ 8                  │
├──────────────────────────┼─────────┼────────────────────┤
│ Concurrency              │ total   │ 0.9972             │
├──────────────────────────┼─────────┼────────────────────┤
│ Max Concurrency          │ total   │ 1                  │
├──────────────────────────┼─────────┼────────────────────┤
│ Request Throughput       │ total   │ 0.4021 req/s       │
├──────────────────────────┼─────────┼────────────────────┤
│ Total Input Tokens       │ total   │ 12100              │
├──────────────────────────┼─────────┼────────────────────┤
│ Prefill Token Throughput │ total   │ 17014.3123 token/s │
├──────────────────────────┼─────────┼────────────────────┤
│ Total generated tokens   │ total   │ 2299               │
├──────────────────────────┼─────────┼────────────────────┤
│ Input Token Throughput   │ total   │ 608.7438 token/s   │
├──────────────────────────┼─────────┼────────────────────┤
│ Output Token Throughput  │ total   │ 115.7835 token/s   │
├──────────────────────────┼─────────┼────────────────────┤
│ Total Token Throughput   │ total   │ 723.5273 token/s   │
╘══════════════════════════╧═════════╧════════════════════╛

03/26 20:22:24 - AISBench - INFO - Performance Result files locate in outputs/default/20250605_202220/performances/vllm-api-stream-chat.
Interpreting performance results
Results include per-request metrics and end-to-end metrics. Parameter meanings:
Per-request performance output
Selected statistics:
- P75 / P90 / P99: For TPOT, for example, the 75th, 90th, and 99th percentiles across requests.
- E2EL (End-to-End Latency): Total time from request send to full response received.
- TTFT (Time To First Token): Latency to the first output token.
- TPOT (Time Per Output Token): Mean time per generated token in the decode phase (excluding the first token).
- ITL (Inter-token Latency): Mean spacing between adjacent tokens (excluding the first).
- InputTokens: Input token count for the request.
- OutputTokens: Generated output token count.
- OutputTokenThroughput: Output tokens per second.
- Tokenizer: Time spent tokenizing input.
- Detokenizer: Time spent decoding tokens to text.
| Performance Parameters | Stage | Average | Max | Min | Median | P75 | P90 | P99 | N |
|---|---|---|---|---|---|---|---|---|---|
| E2EL | Stage where this stat applies | Mean request latency | Max request latency | Min request latency | Median request latency | P75 latency | P90 latency | P99 latency | Sample count (from workload config) |
| TTFT | Same | Mean first-token latency | Max first-token | Min first-token | Median first-token | P75–P99 first-token | Same | ||
| TPOT | Same | Mean decode latency | Max decode | Min decode | Median decode | P75–P99 decode | Same | ||
| ITL | Same | Mean inter-token delay | Max / min / median / percentiles | Same | |||||
| InputTokens | Same | Mean input length | Max / min / median / percentiles | Same | |||||
| OutputTokens | Same | Mean output length | Max / min / median / percentiles | Same | |||||
| OutputTokenThroughput | Same | Mean output throughput | Max / min / median / percentiles | Same |
End-to-end performance output
| Field | Description |
|---|---|
| Benchmark Duration | Total wall-clock time of the benchmark |
| Total Requests | Total requests sent |
| Failed Requests | Failed requests (no response or empty response) |
| Success Requests | Successful responses (empty or non-empty) |
| Concurrency | Observed mean concurrency |
| Max Concurrency | Configured maximum concurrency |
| Request Throughput | Requests per second |
| Total Input Tokens | Sum of input tokens |
| Prefill Token Throughput | Token/s during prefill |
| Total Output Tokens | Sum of generated tokens |
| Input Token Throughput | Input token throughput |
| Output Token Throughput | Output token throughput |
| Total Token Throughput | Combined input + output throughput |
Concurrency visualization (HTML plot)
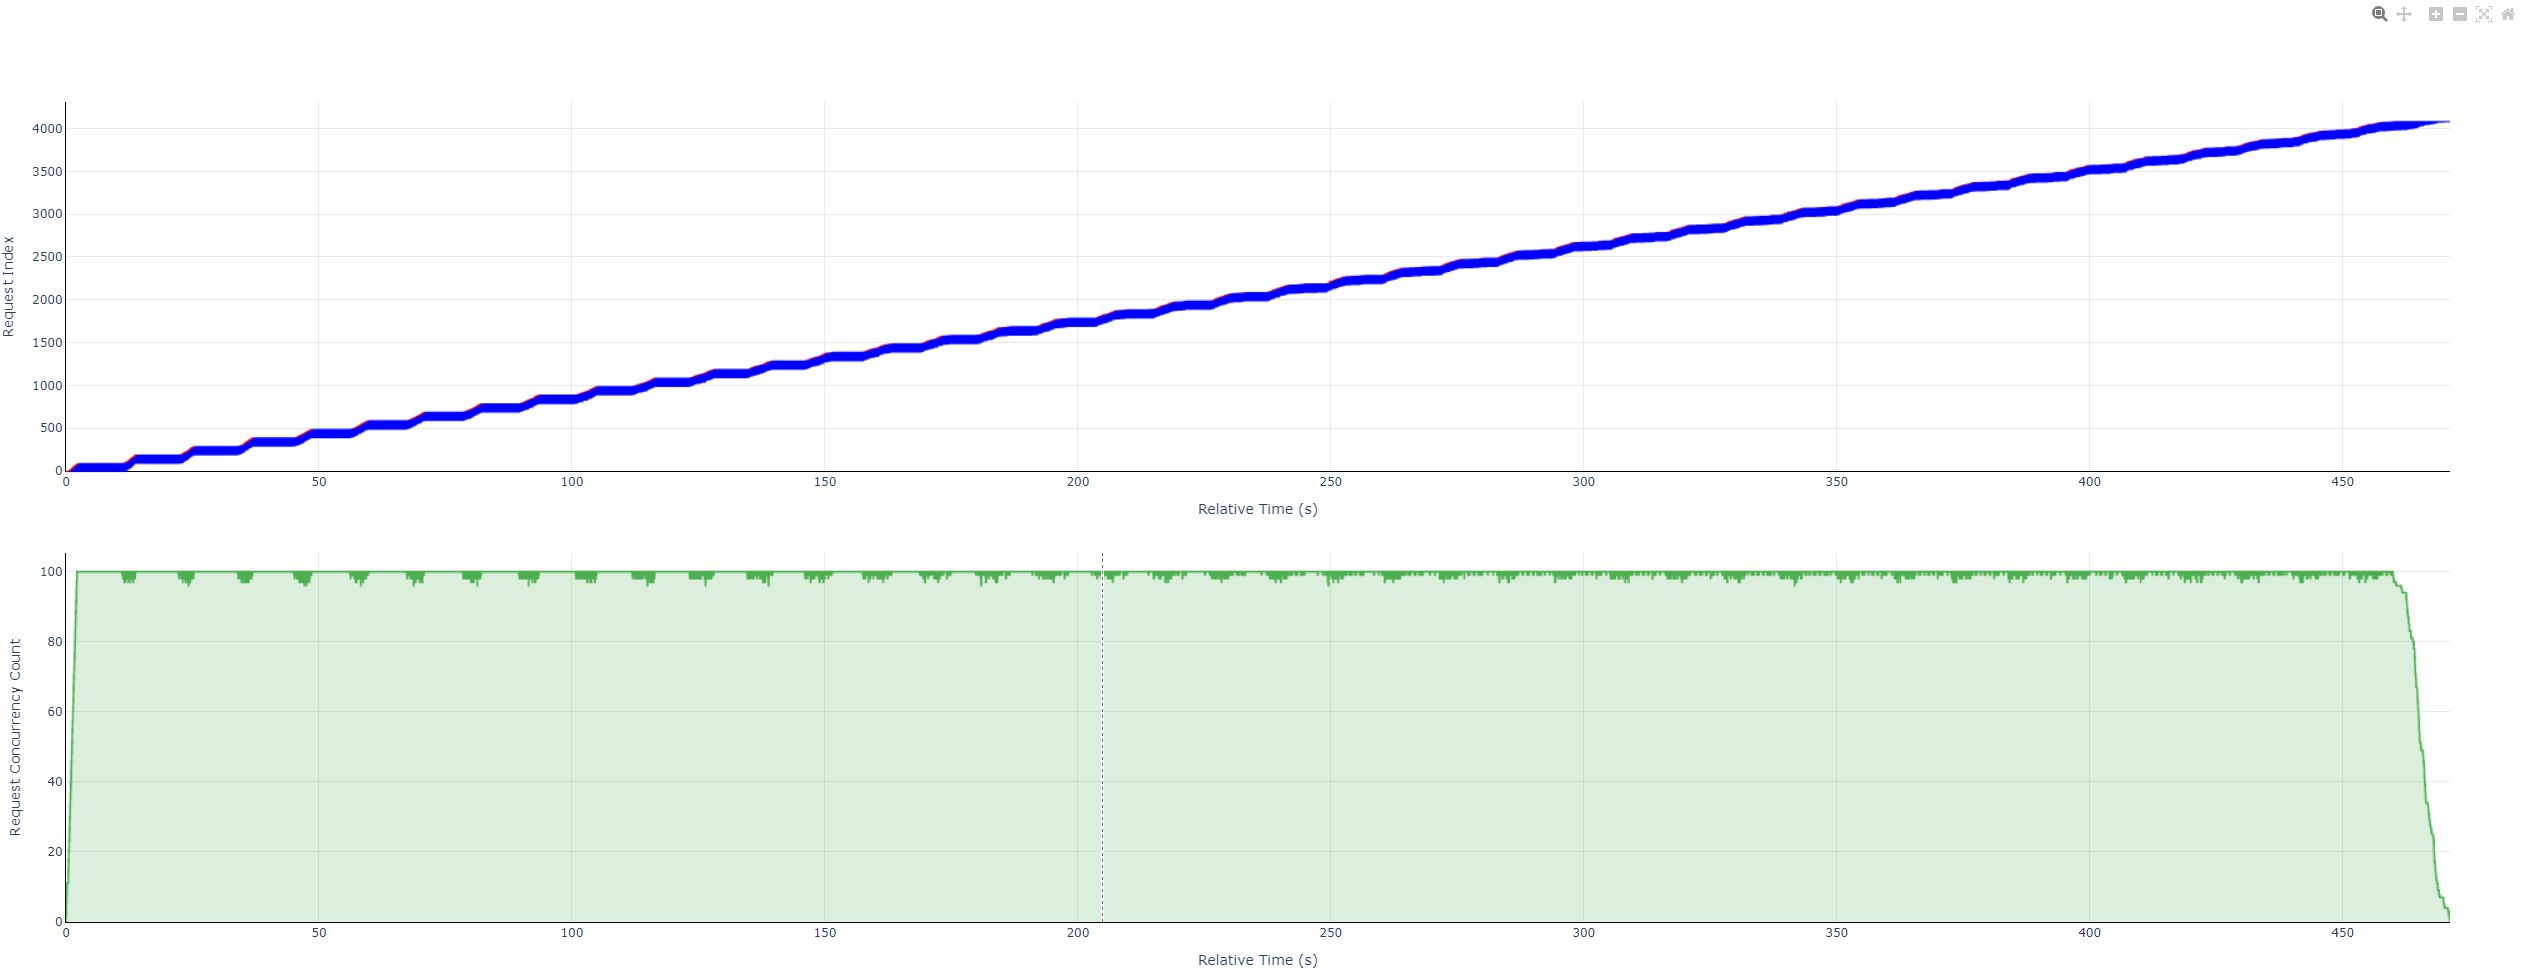
The chart shows detailed inference timing during the benchmark:
- Per-request timing: Prefill, decode, and end-to-end duration for each request.
- Live concurrency: How concurrency evolves over time—useful for scheduling and throughput.
Highlights
- Granular timing: Break down each request to see whether bottlenecks sit in prefill or decode.
- Concurrency over time: See load swings and stability under concurrent load.
- Large-scale replay: Suitable for stress tests and sustained-load analysis.
Typical uses
- Tuning: Find bottlenecks; tune latency, concurrency limits, and batching.
- Load testing: Validate deployed services against target concurrency.
- Deployment comparison: Compare models or deployment modes (e.g. local vs served) under the same load.
How it is produced: The performance run emits an HTML report. Open it in any modern browser to explore per-request timing and the concurrency curve interactively.
Viewing the performance report file
1. View controls
Hover the top-right of the plot to show the toolbar.
Toolbar (left to right)
| Name | Icon | Action | Legend |
|---|---|---|---|
| Download | Camera | Capture the current view as png |  |
| Zoom | Magnifier | Zoom mode; see Mouse actions → Drag canvas |  |
| Pan | Crosshair | Pan mode; see Drag canvas |  |
| Zoom in | Plus | Zoom both panels in, centered on the view |  |
| Zoom out | Minus | Zoom both panels out |  |
| Autoscale | Expand frame | Fit the plot to the data |  |
| Reset axes | Home | Reset to the initial view |  |
2. Reading the data
- Examples
- Overview
- Request timeline
- With decode legend
- Without decode legend
- With decode legend
- Concurrency steps
- Overview
- Legend and math
- Request timeline
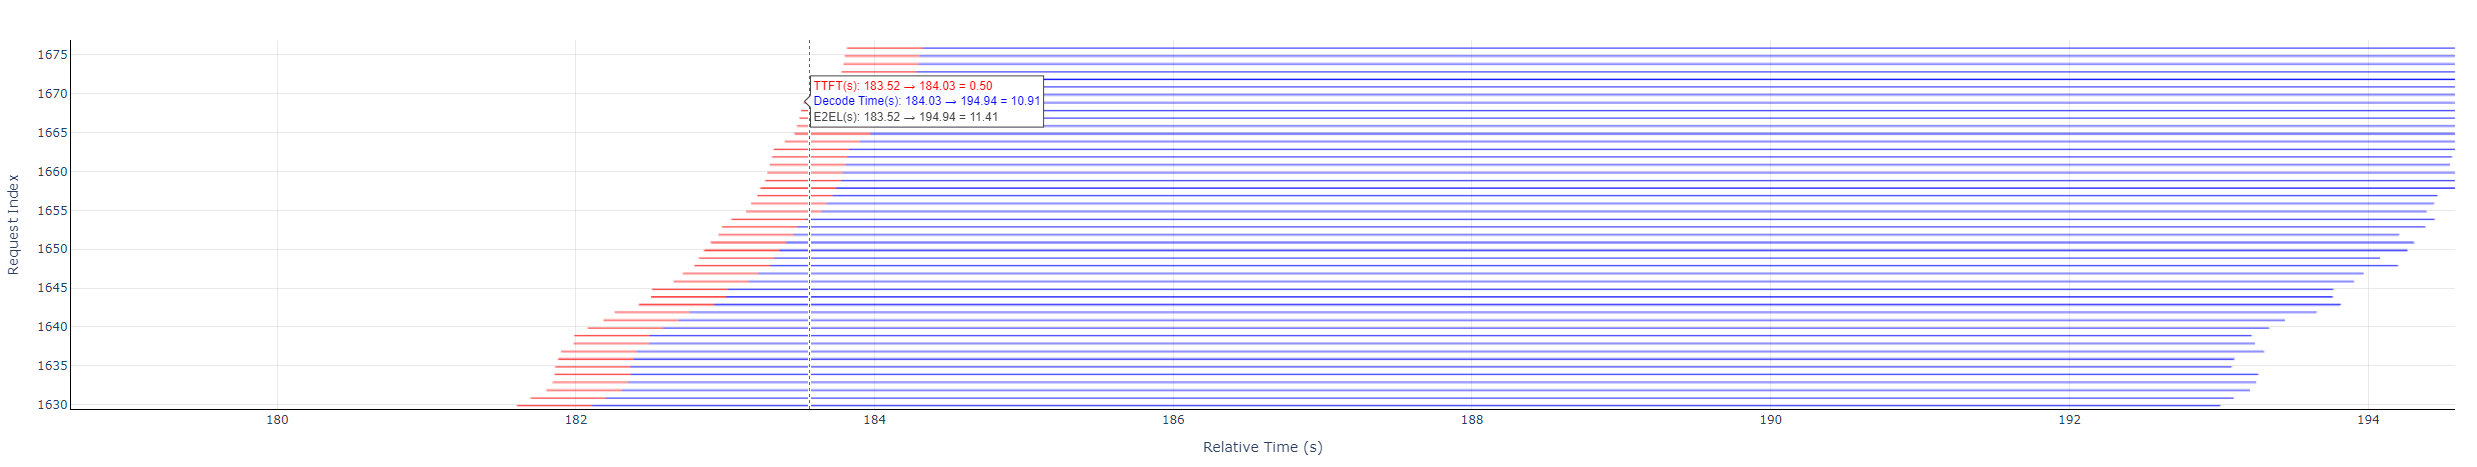
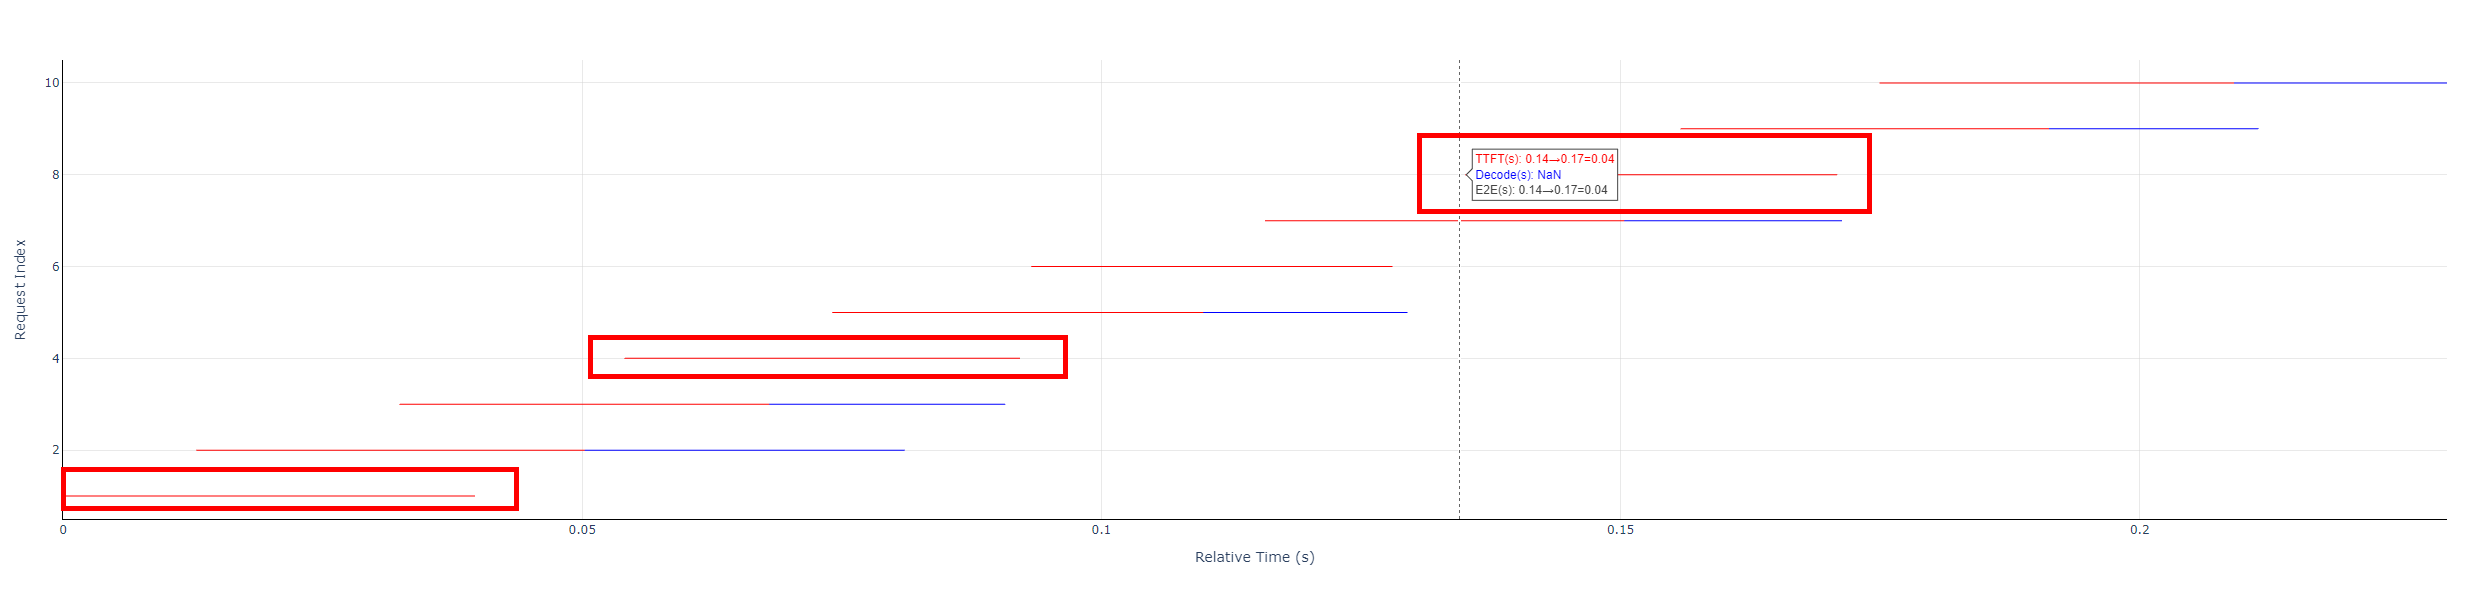
- Each horizontal bar: red and blue segments (or red only) = E2EL for one request.
- Red: TTFT (time to first token).
- Blue: Decode (non-first-token time).
- Formulas
- TTFT =
prefill_latency - Decode =
end_time- (start_time+prefill_latency) - E2EL =
end_time-start_time
- TTFT =
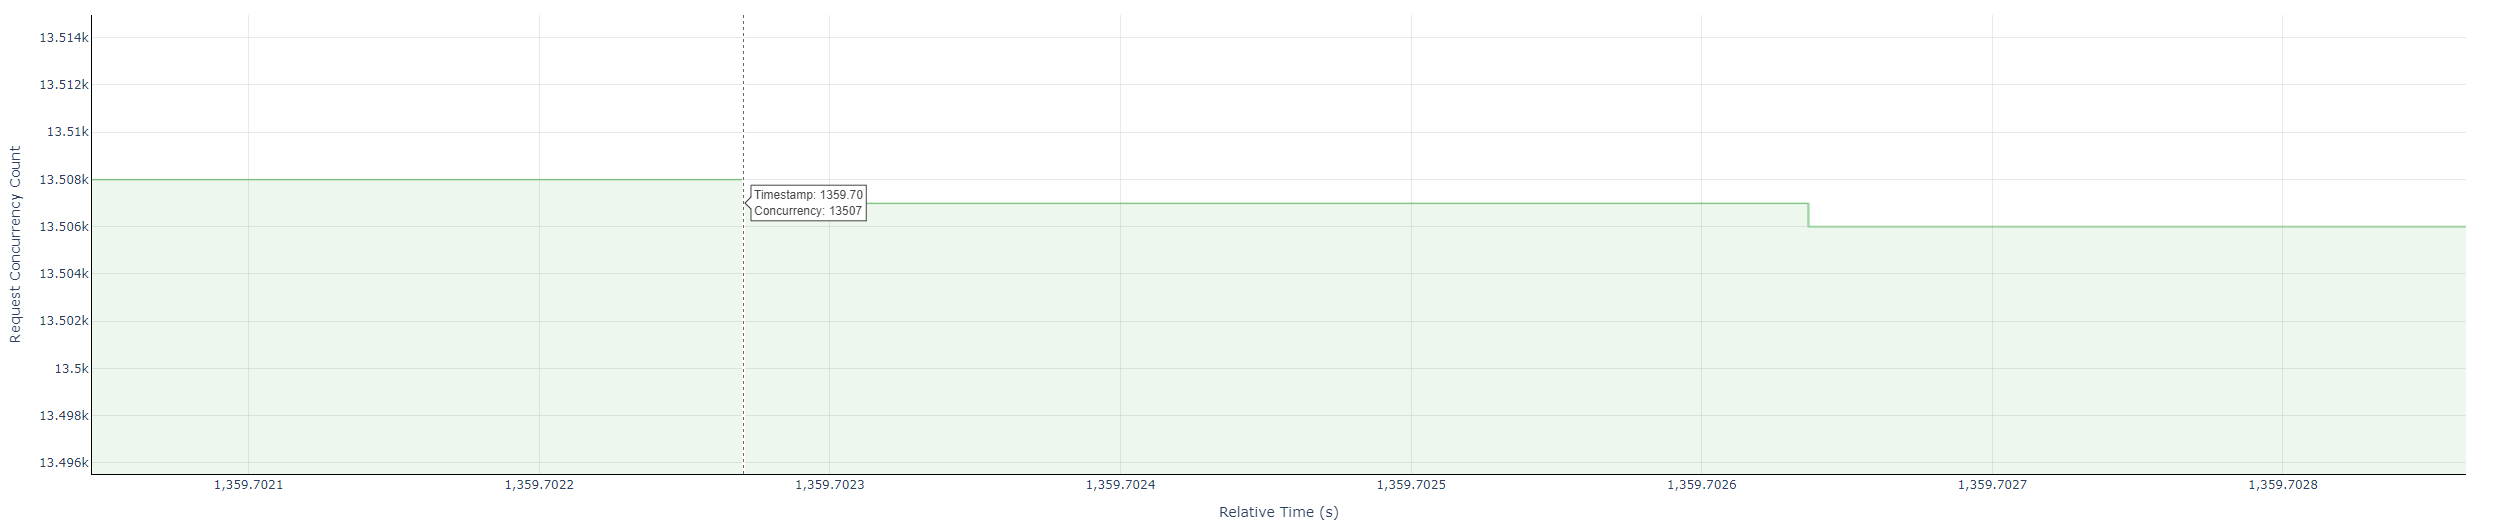
- Concurrency plot
- Green steps: concurrent in-flight requests over time.
- Value: count of active requests at each instant.
- Request timeline
- Tooltips
- Request timeline: hover near the start of a request bar to see TTFT, decode time, and E2EL.
- Concurrency: hover near step corners for timestamp and concurrency.
- Axes
- Request timeline: X — relative time from 0 (seconds); Y — request index from 1.
- Concurrency: X — relative time (seconds); Y — concurrent request count from 1.
Source for the above: AISBench documentation.